5.0 KiB
| title | date | author | tags | categories | |||
|---|---|---|---|---|---|---|---|
| 矢量瓦片 | 2020-10-20 | ac |
|
|
Vector Tiles 是一种输出格式,而不是数据源
1. 矢量瓦片
1.1 矢量瓦片是什么?
顾名思义,矢量瓦片包含的是几何信息(geometry)和元数据(attributes),是一种轻量级的紧凑型结构化的用于存储地理空间矢量数据的【数据格式】。
1.2 格式与编码规则
格式:
矢量瓦片使用Google Protobufs (PBF)数据转换格式(用于序列化结构化数据)对矢量数据进行编码,生成以.mvt为后缀的文件。使用Mapnik或Node Mapnik之类的工具可以将单个矢量图块快速编码为.mvt格式(Mapbox Vector Tile format)。
编码规则
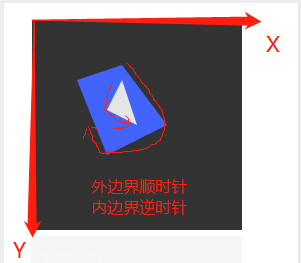
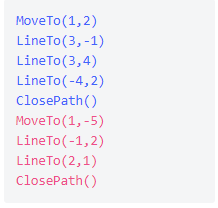
几何属性的编码规则:
- 数据必须为地理坐标,矢量瓦片没有地理信息的概念(geographic information);
- 以自右向下(顺时针)的方式将点、线和多边形编码为相对于网格左上角的x/y坐标对。即将地理坐标信息转换为相对于图块的非地理矢量网格坐标(non-geographic vector grid coordinates)
1.3 优点缺点
矢量图块(Vector Tiles)的优点是:
- 渲染是由客户端(例如
OpenLayers)完成的,而不是由服务器完成的。这允许不同的地图/应用程序以不同的方式设置地图样式,而不必重新配置GeoServer。 - 向量图块的大小通常小于图像图块,从而导致更快的数据传输和更低的带宽使用率。
GeoServer内嵌的GeoWebCache有效地存储了矢量切片数据。由于样式是由客户端而不是服务器完成的,因此GeoWebCache仅需要为所有不同的样式存储一个图块。- 由于矢量数据在客户端上可用,因此可以绘制非常高分辨率的地图,而不会相应增加带宽。
- 客户端可以本地访问实际的特征信息(属性和几何形状),从而可以进行非常复杂的渲染。
它主要缺点是,可能需要对地理数据进行预处理,以使客户可以进行所需的绘图(类似于对图像地图进行预处理的数据)。考虑到这一点,矢量 tiles更适用于渲染。
2. GeoServer中的矢量瓦片
GeoServer除了支持标准的image tiles输出格式外,还支持vector tiles的输出格式。
标准WMS将生成具有地理参考的地图图像作为输出,而vector tiles矢量瓦片是输出包含地理参考的矢量数据,这些数据被裁剪成图块以便于检索。
GeoServer还可以输出三种格式的矢量切片:GeoJSON,TopoJSON和MapBox Vector(MVT)
GeoServer默认不支持Vector Tiles输出格式,需要添加Vector Tiles扩展。
在需要输出Vector Tiles格式的矢量图层中勾选矢量输出格式:
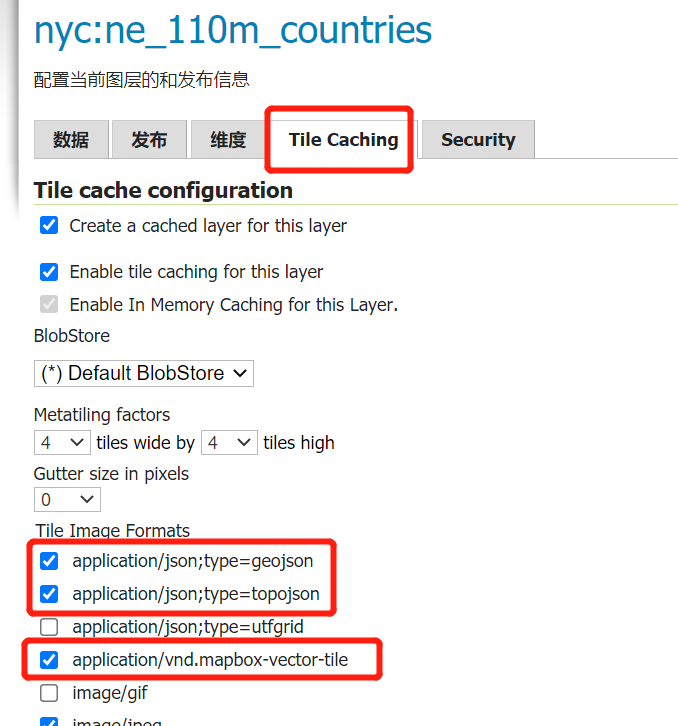
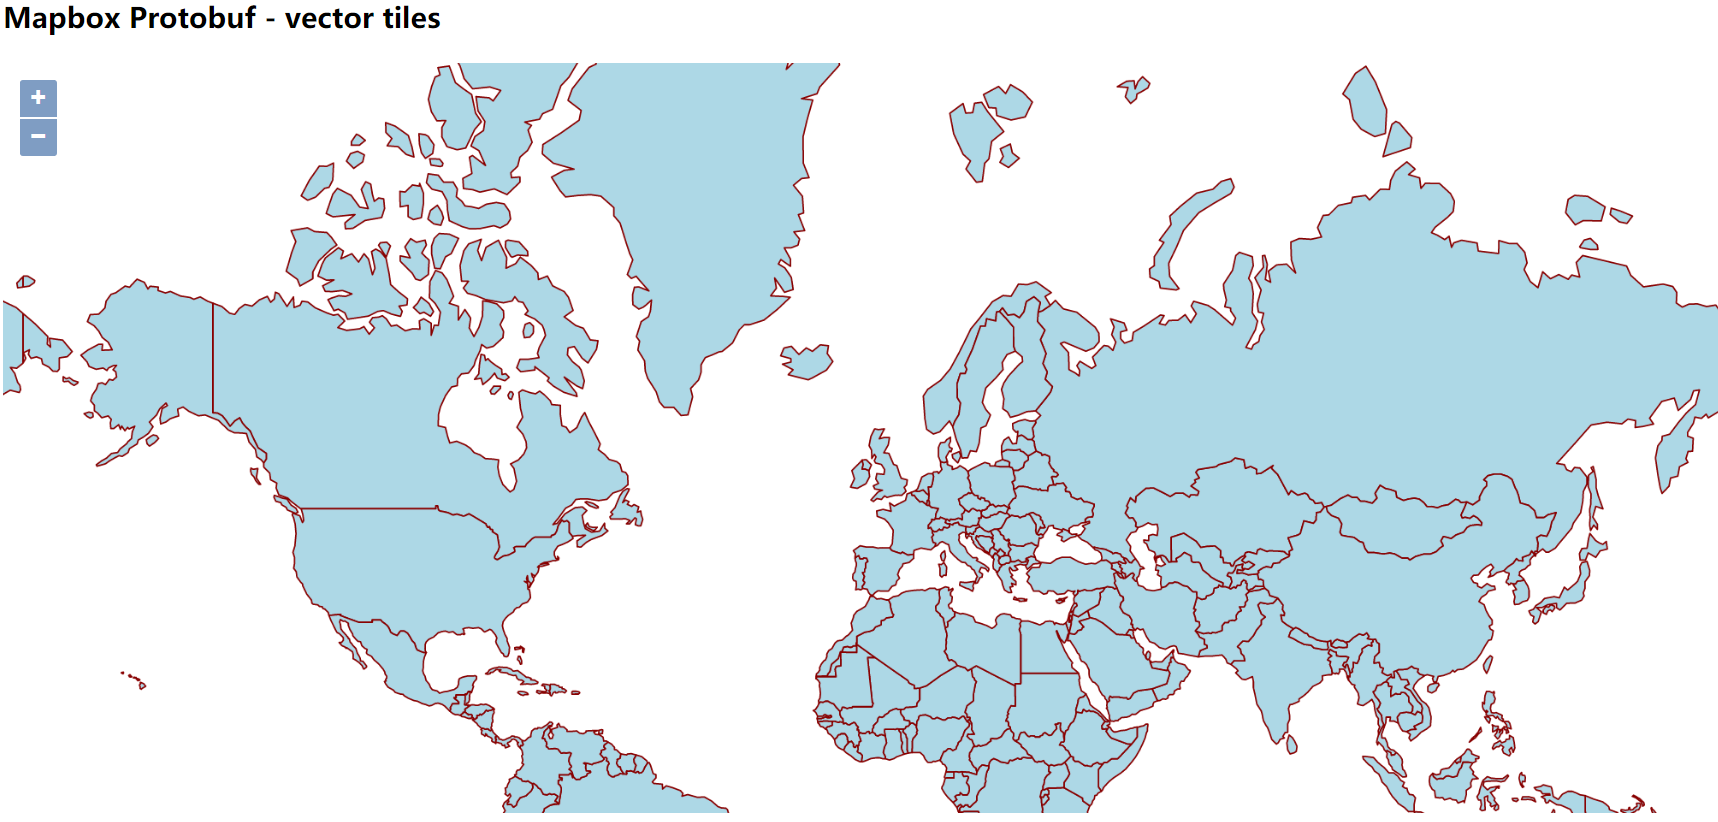
加载GeoServer中输出的矢量瓦片,示例:
<!DOCTYPE html -->
<html>
<head>
  <title>Vector tiles</title>
  <script src="https://cdn.jsdelivr.net/gh/openlayers/openlayers.github.io@master/en/v6.5.0/build/ol.js"></script>
  <link rel="stylesheet" href="https://cdn.jsdelivr.net/gh/openlayers/openlayers.github.io@master/en/v6.5.0/css/ol.css">
  <style>
    html, body {
      font-family: sans-serif;
      width: 100%;
    }
    .map {
      height: 500px;
      width: 100%;
    }
  </style>
</head>
<body>
  <h3>Mapbox Protobuf - vector tiles</h3>
  <div id="map" class="map"></div>
  <script>

  var style_simple = new ol.style.Style({
    fill: new ol.style.Fill({
      color: '#ADD8E6'
    }),
    stroke: new ol.style.Stroke({
      color: '#880000',
      width: 1
    })
  });

  function simpleStyle(feature) {
    return style_simple;
  }

  var layer = 'nyc:ne_110m_countries';
  var projection_epsg_no = '900913';
  var map = new ol.Map({
    target: 'map',
    view: new ol.View({
      center: [0, 0],
      zoom: 2
    }),
    layers: [
      new ol.layer.VectorTile({
      style:simpleStyle,
      source: new ol.source.VectorTile({
        tilePixelRatio: 1, // oversampling when > 1
        tileGrid: ol.tilegrid.createXYZ({maxZoom: 19}),
        format: new ol.format.MVT(),
        url: 'http://localhost:8080/geoserver/gwc/service/tms/1.0.0/' + layer +
            '@EPSG%3A'+projection_epsg_no+'@pbf/{z}/{x}/{-y}.pbf'
      })
    })]
  });
  </script>
</body>
</html>
加载矢量切片时,建议使用最新的ol。较旧的ol不支持所有矢量切片功能,并且可能导致渲染错误。
参考文章
[1] Vector tiles https://docs.mapbox.com/vector-tiles/reference/
[2] Specification https://docs.mapbox.com/vector-tiles/specification/