---
title: 发布PostGIS表
date: 2021-01-02
author: ac
tags:
- GeoServer
- PostGIS
categories:
- GIS
---
### 一、环境准备
> PostgreSQL 与 PostGIS 版本的对应关系:https://trac.osgeo.org/postgis/wiki/UsersWikiPostgreSQLPostGIS
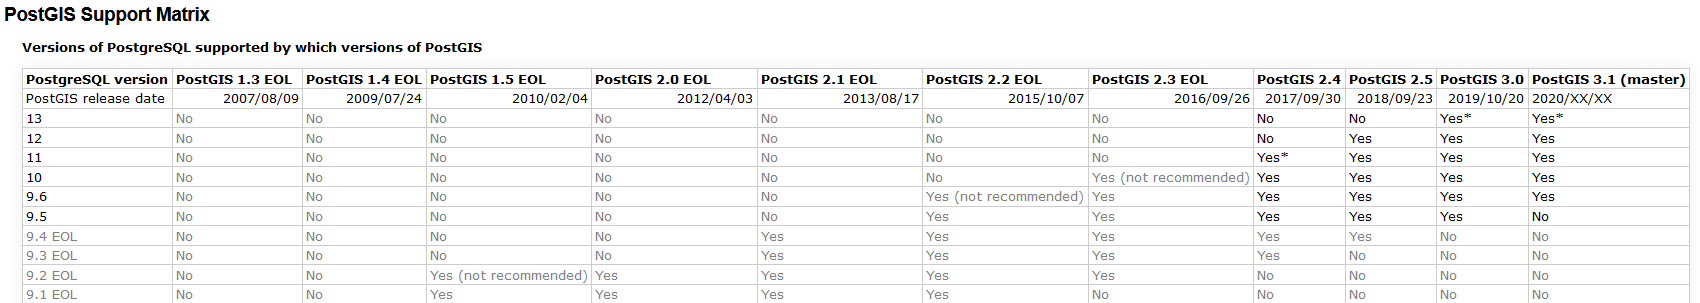
#### 1. 安装PostgreSQL
在决定好[PostgreSQL](https://www.postgresql.org/download/)和[PostGIS](http://postgis.net/install/)的版本后,去下载相应版本的安装包。(这里使用的是windows平台下的)
#### 2.安装PostGIS
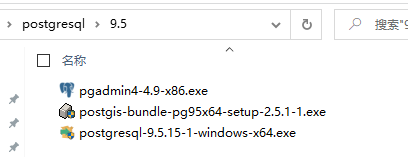
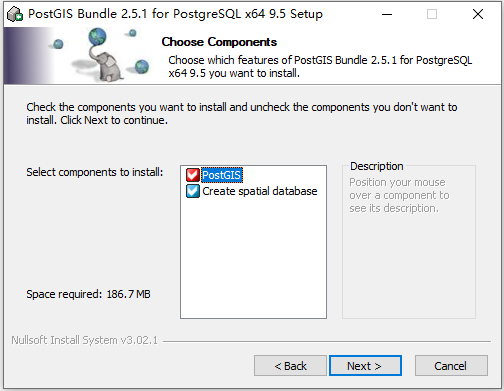
安装完`PostgreSQL`后,开始安装空间数据的扩展模块`PostGIS`。
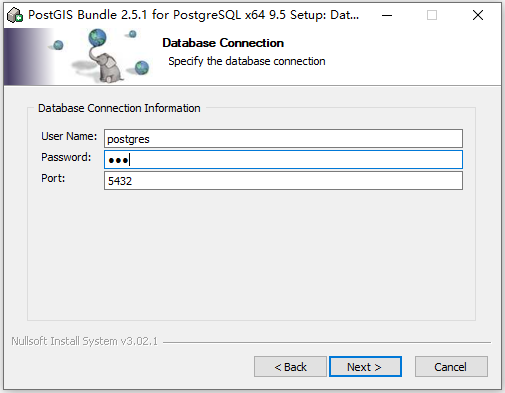
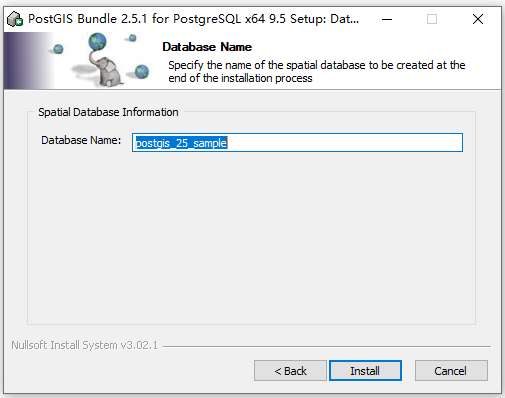
安装方式都比较简单,一直下一步就可以安装成功。安装PostGIS过程中可以选择创建空间数据库的模版数据库,勾选后会提示输入本地安装的`PostgreSQL`用户密码和被创建的模版数据库名称。
安装完 PostGIS 后,PostGIS 是作为一个可选的扩展模块,如果要使用它,除了模版数据库外,其他数据库必须在数据库中启用它。
```sql
-启用PostGIS(从3.0版开始仅包含geometry/geography)
CREATE EXTENSION postgis;
```
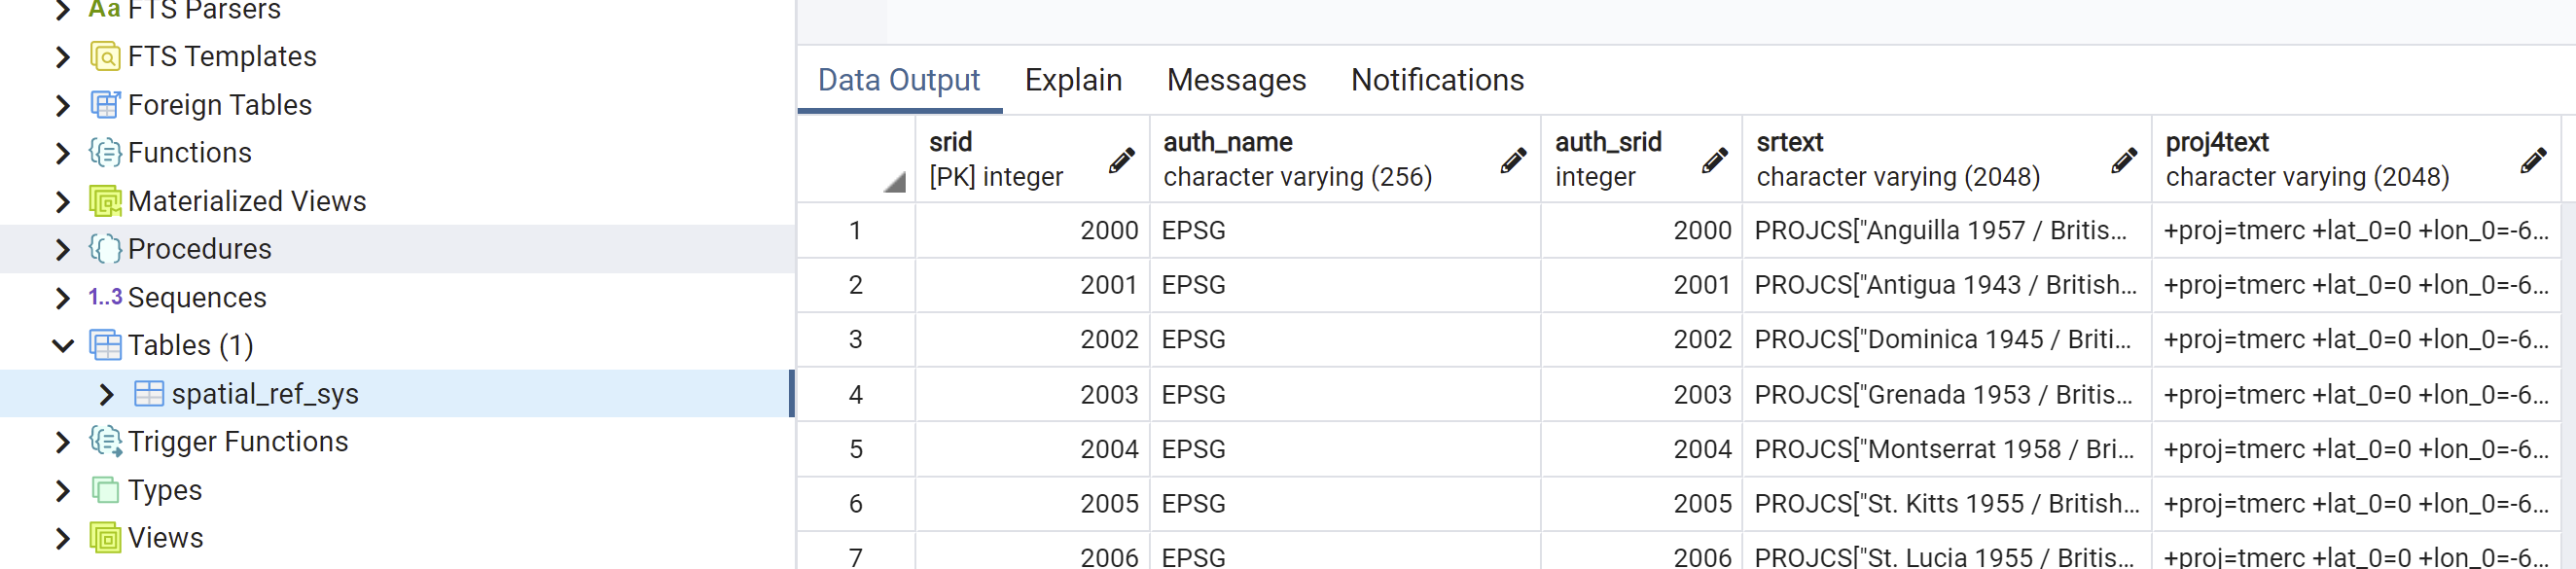
启动成功后库中就会多一张`spatial_ref_sys`表。
### 二、示例
现在根据GeoServer官网上的教程走一遍:
#### 1.下载数据
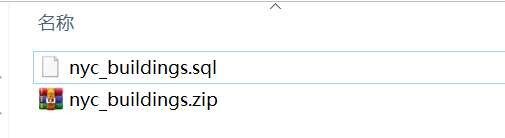
[`nyc_buildings.zip`](https://docs.geoserver.org/2.13.2/user/_downloads/nyc_buildings.zip) 。
 #### 2.导入数据
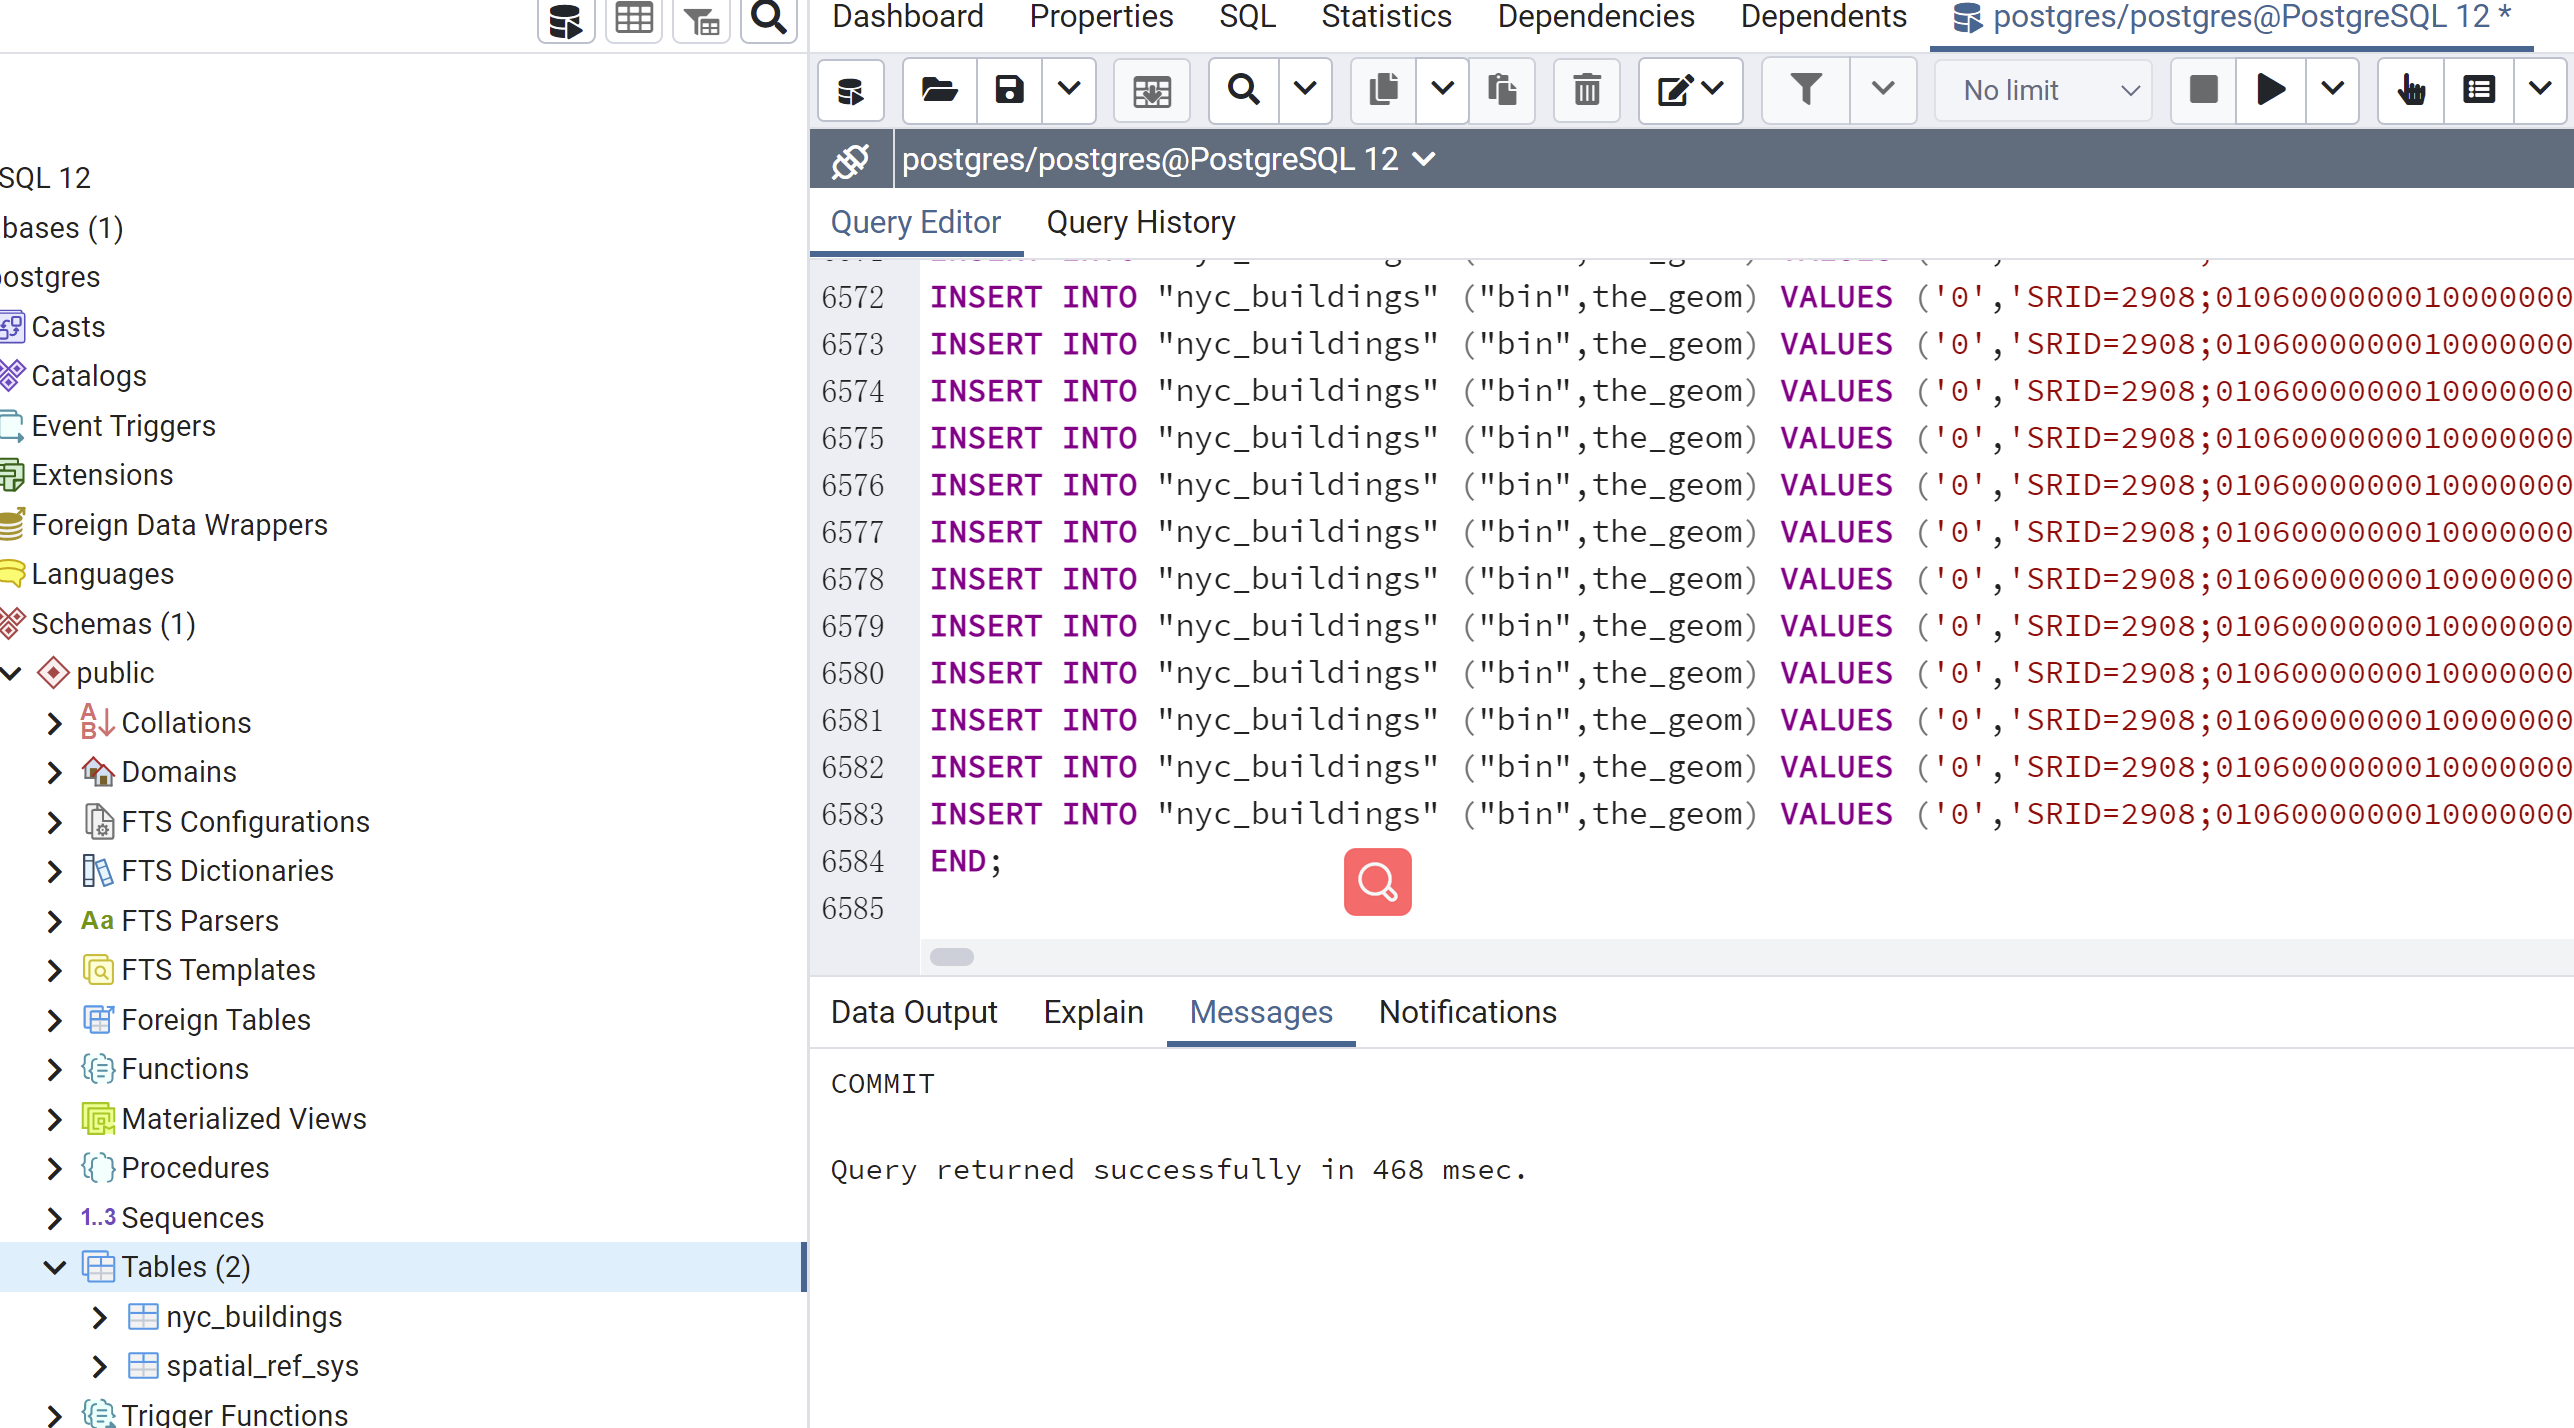
将`nyc_buildings.sql`的内容粘贴到查询窗口中执行,刷新Tables就可以看到对应的表了;
#### 3. 添加新的workspace
填写配置信息。
#### 2.导入数据
将`nyc_buildings.sql`的内容粘贴到查询窗口中执行,刷新Tables就可以看到对应的表了;

#### 3. 添加新的workspace
填写配置信息。
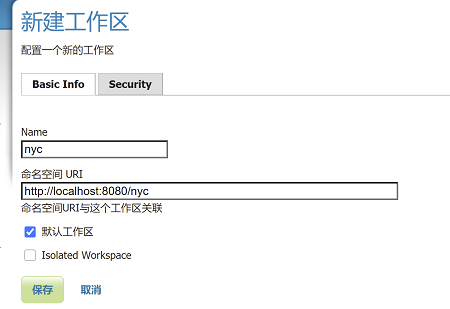 > 工作区名称是描述项目的标识符。不能超过10个字符,也不能包含空格。名称空间URI(统一资源标识符)通常可以是与项目关联的URL,并添加一个指示工作区的尾随标识符。文件中的名称空间URI不需要解析为实际有效的web地址。
#### 4. 新增数据存储
选择`PostGIS-PostGIS Database` 数据源。
> 工作区名称是描述项目的标识符。不能超过10个字符,也不能包含空格。名称空间URI(统一资源标识符)通常可以是与项目关联的URL,并添加一个指示工作区的尾随标识符。文件中的名称空间URI不需要解析为实际有效的web地址。
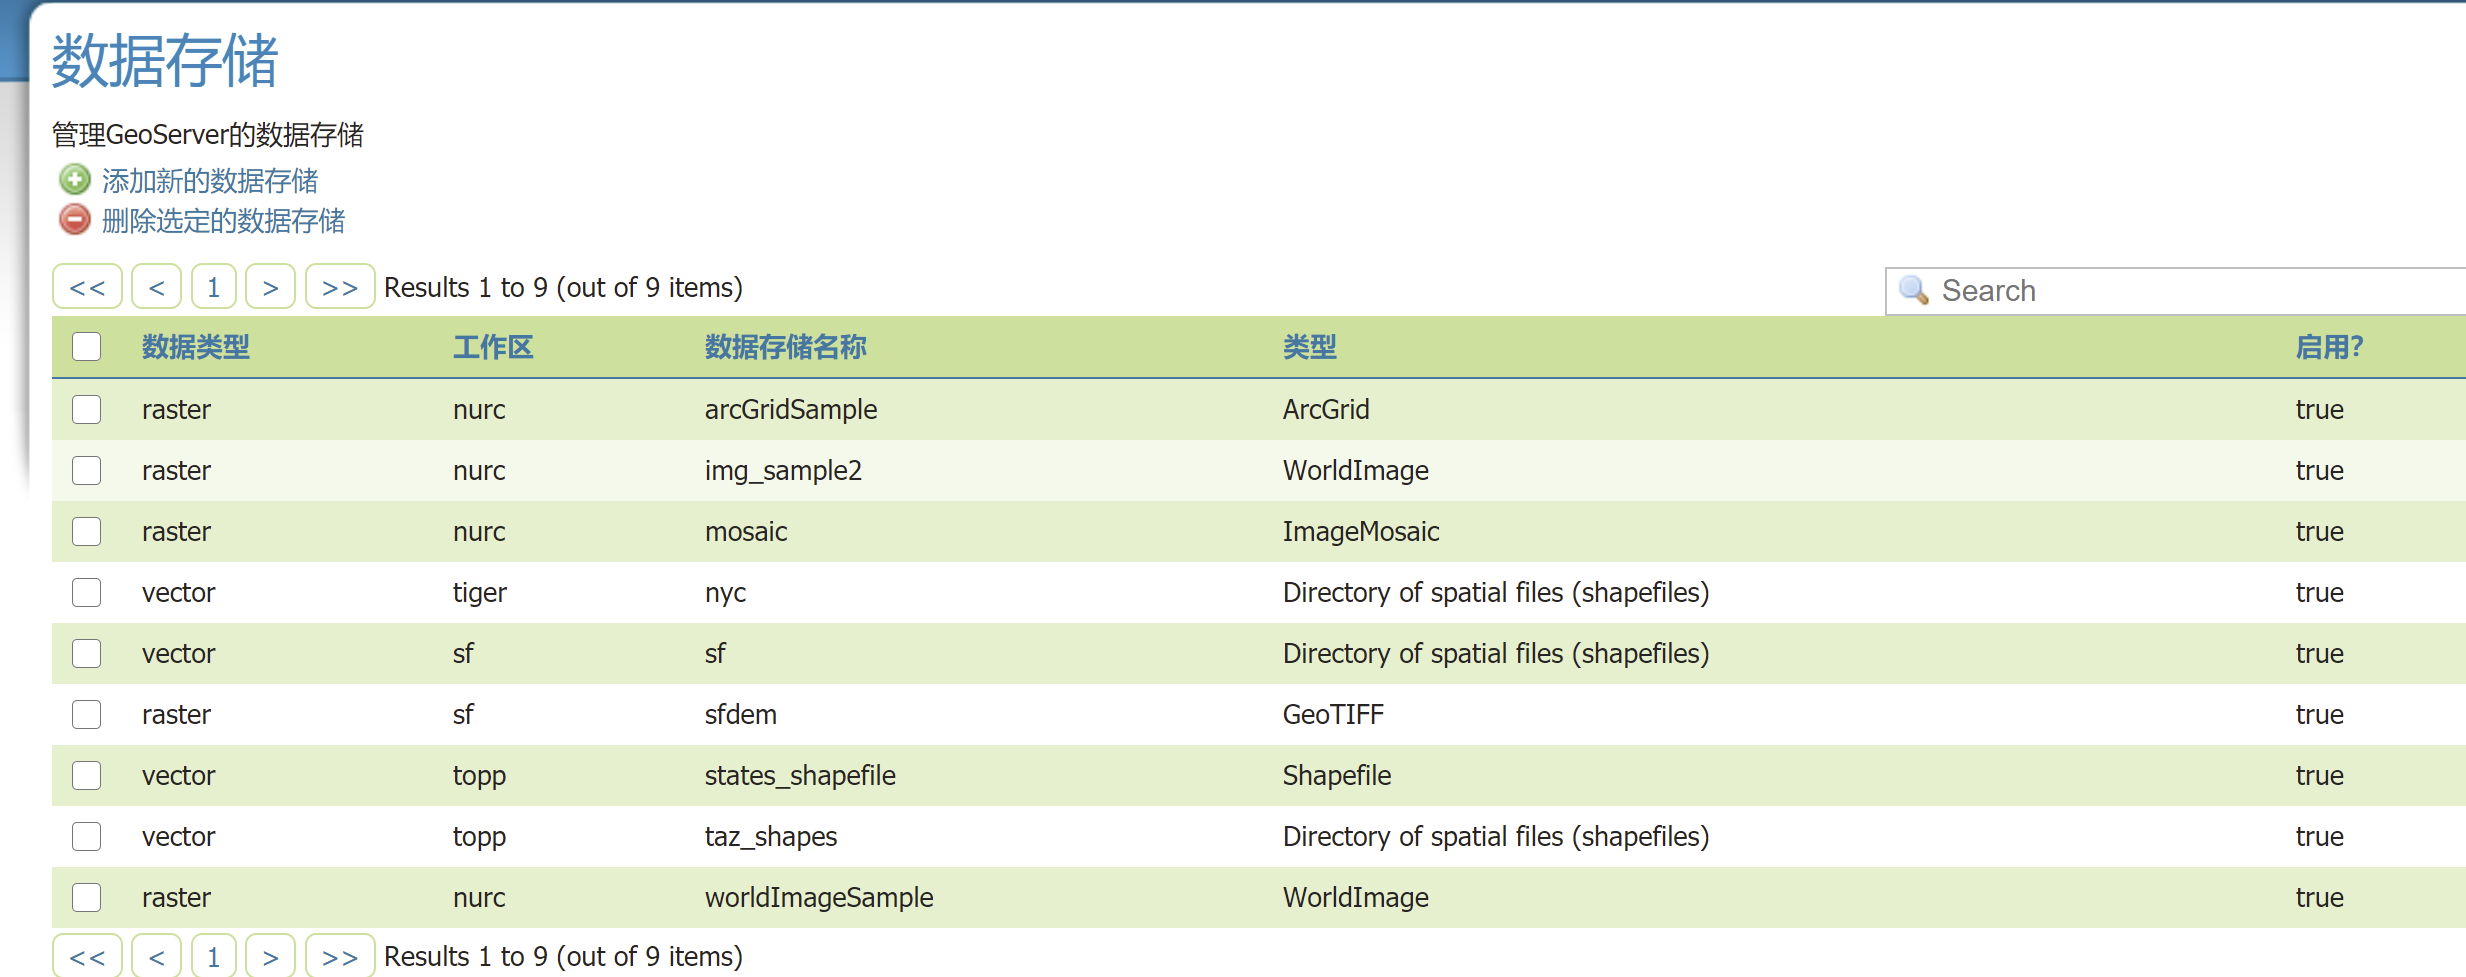
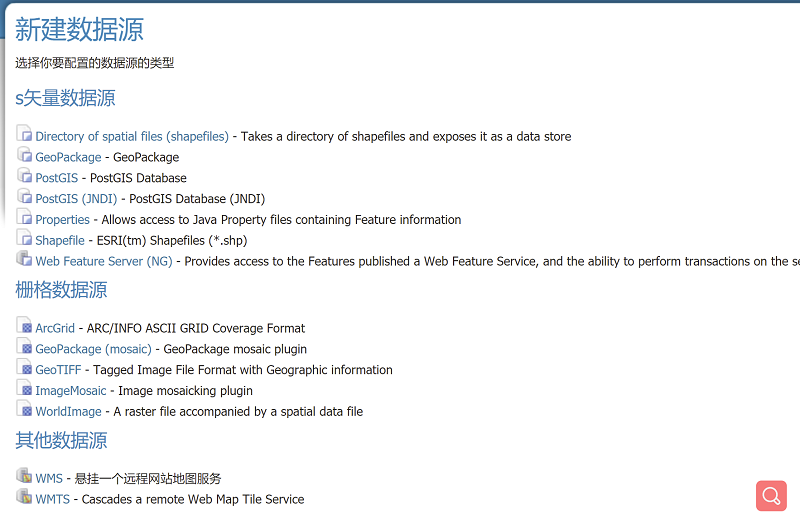
#### 4. 新增数据存储

选择`PostGIS-PostGIS Database` 数据源。
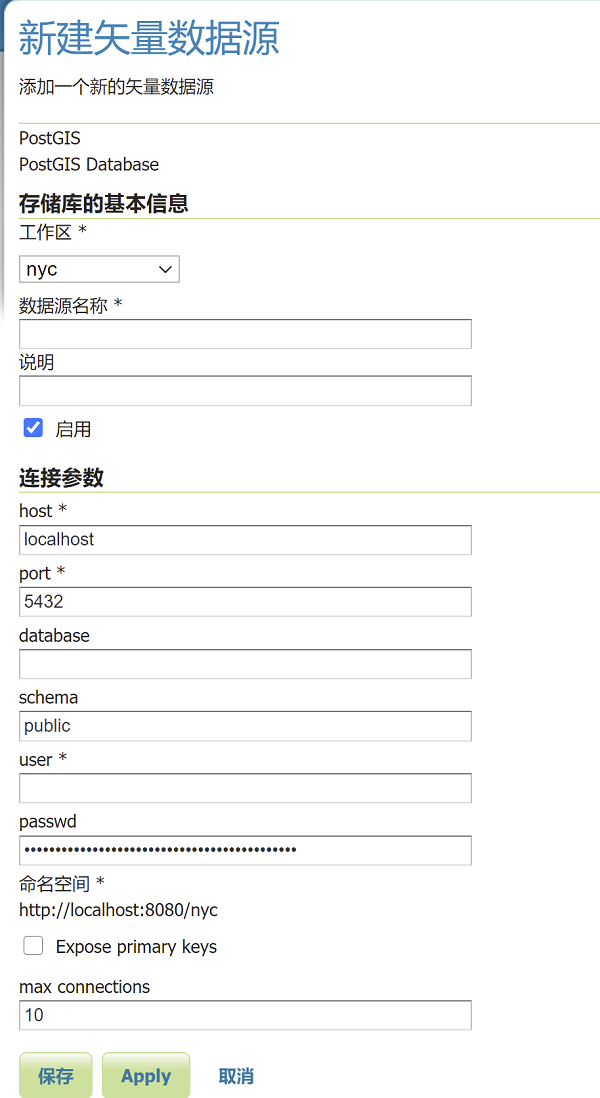 选择新建的工作区,配置数据源名称,填写刚导入数据的数据库的连接信息。
> 其中的`Expose primary keys` 是暴露主键,每张导入postgis的矢量数据表都会生成一个`gid`属性,作为矢量数据记录的标识。对于事务WFS,该表必须具有主键。没有主键的表被视为对 GeoServer 只读。
>
#### 5. 创建图层
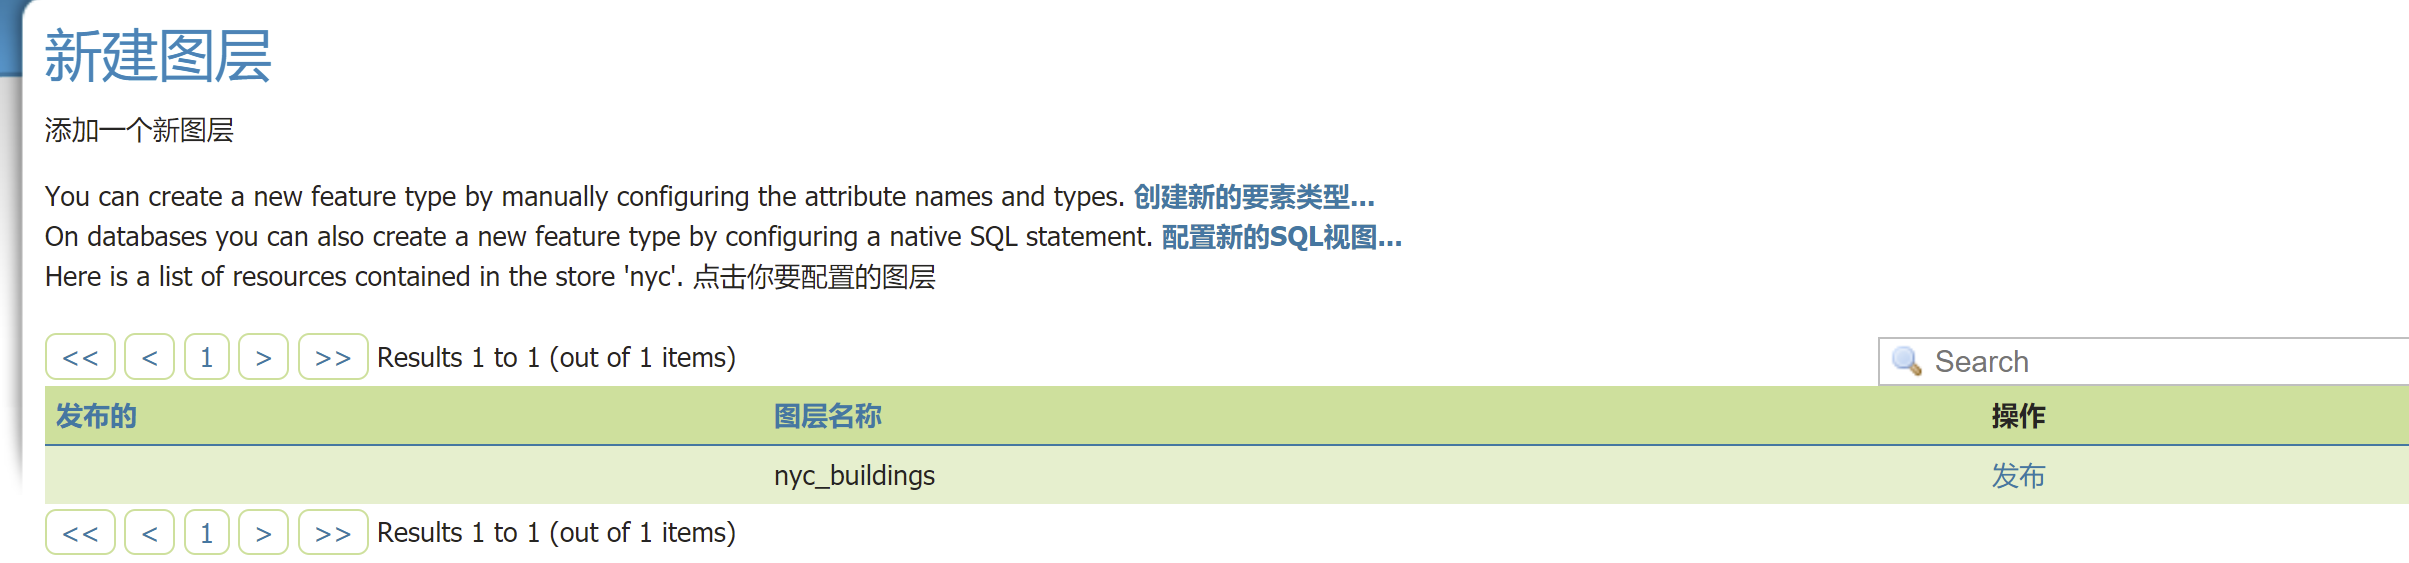
在保存数据源后,系统会检测该数据源中存在的矢量数据。这里我点击“发布”就可以进入图层的配置界面:
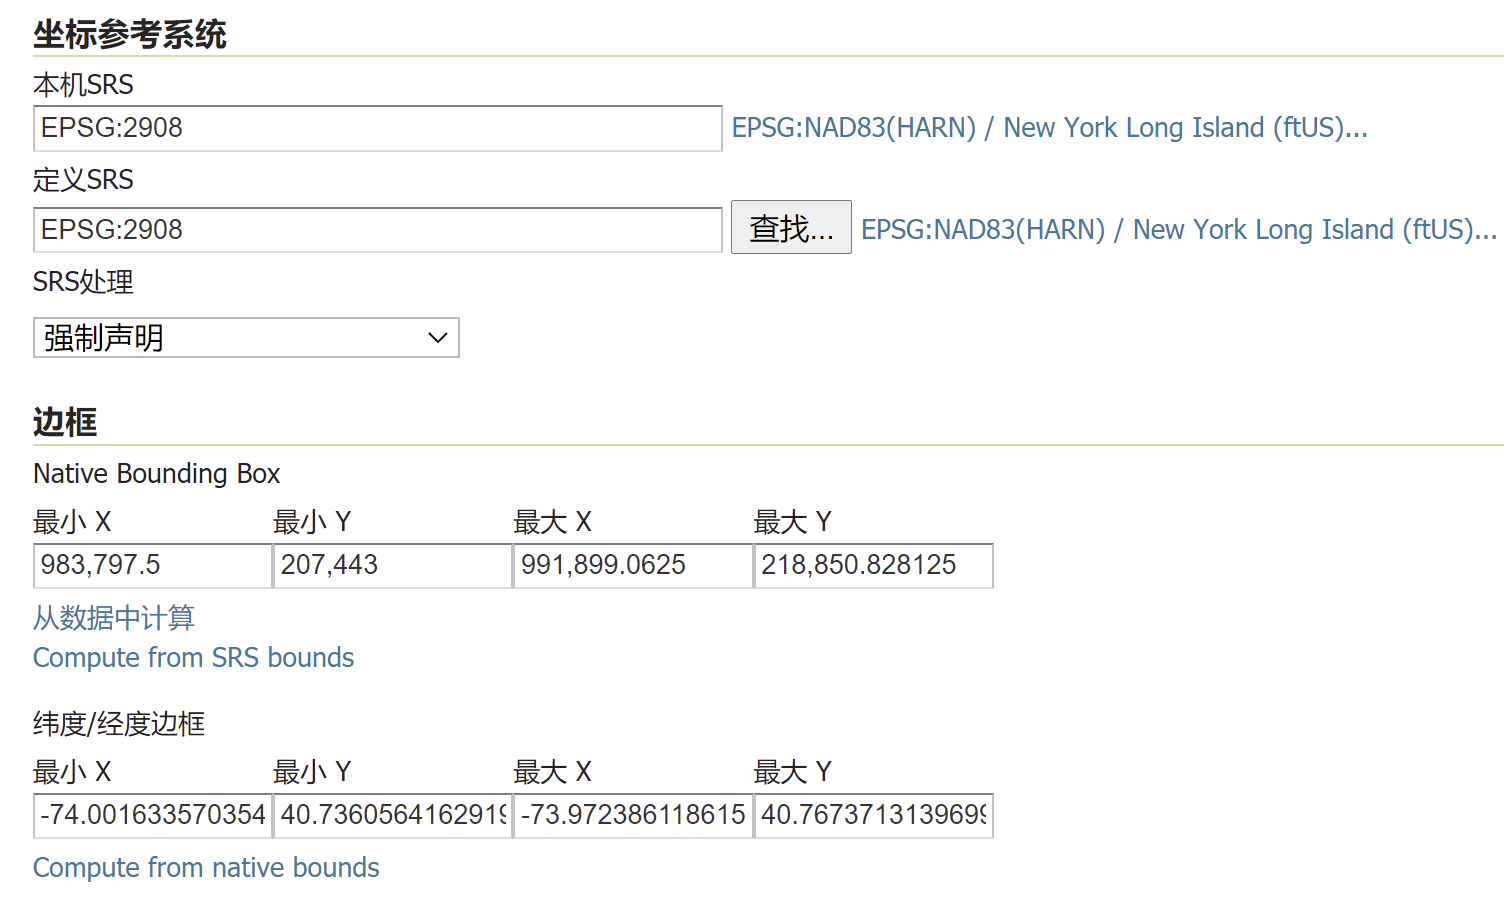
主要的配置是【数据】tab页的 **坐标参考系统**、**边框** ,这里已经识别了数据的坐标参考系,点击"从数据中计算"和"Compute from native bounds"就会填充数据边框。
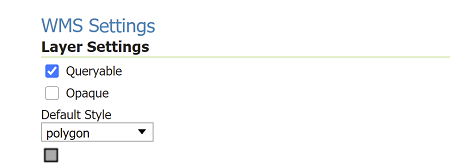
关于图层的样式,在【发布】tab页的WMS settings 中的Default Style 进行配置,这里我们选择了GeoServer自带的默认的面样式。选择完后点击“保存”,图层就发布完毕了。
选择新建的工作区,配置数据源名称,填写刚导入数据的数据库的连接信息。
> 其中的`Expose primary keys` 是暴露主键,每张导入postgis的矢量数据表都会生成一个`gid`属性,作为矢量数据记录的标识。对于事务WFS,该表必须具有主键。没有主键的表被视为对 GeoServer 只读。
>
#### 5. 创建图层

在保存数据源后,系统会检测该数据源中存在的矢量数据。这里我点击“发布”就可以进入图层的配置界面:
主要的配置是【数据】tab页的 **坐标参考系统**、**边框** ,这里已经识别了数据的坐标参考系,点击"从数据中计算"和"Compute from native bounds"就会填充数据边框。

关于图层的样式,在【发布】tab页的WMS settings 中的Default Style 进行配置,这里我们选择了GeoServer自带的默认的面样式。选择完后点击“保存”,图层就发布完毕了。
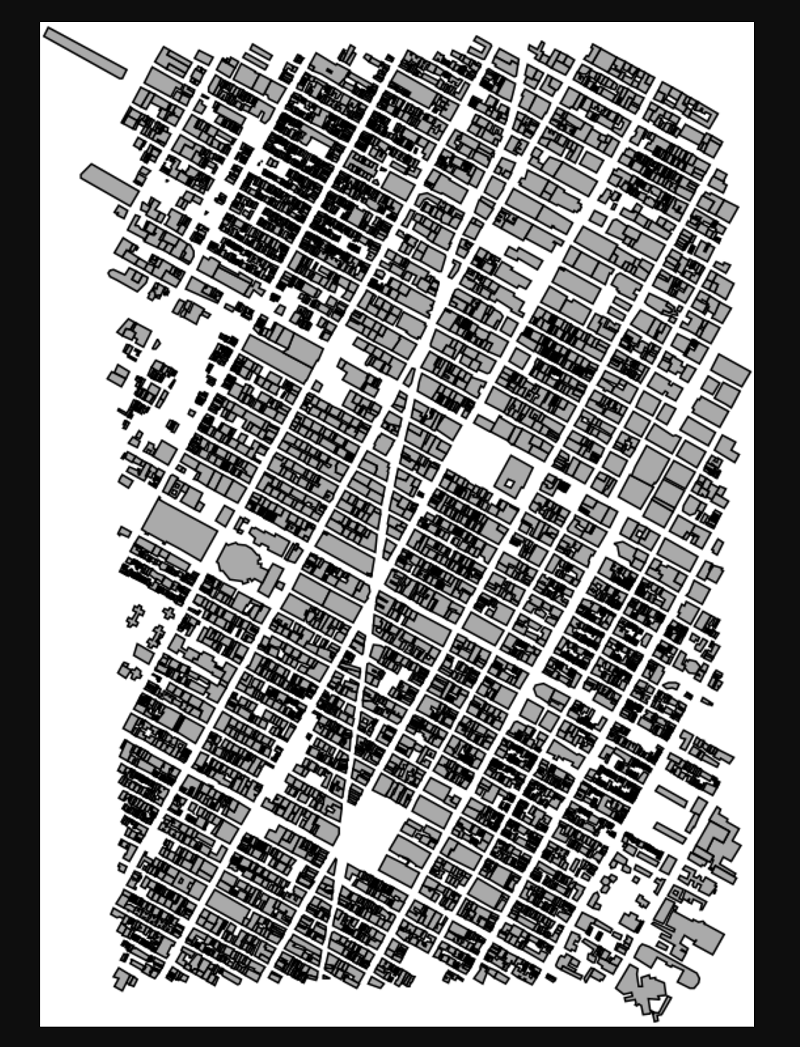
 #### 6.图层预览
返回主页,点击`layer Preview`,选择需要预览的图层的预览格式。也可以直接点击"Common Formats"中的`Openlayers`进行预览。

这里选择`PNG`图片格式查看。
#### 6.图层预览
返回主页,点击`layer Preview`,选择需要预览的图层的预览格式。也可以直接点击"Common Formats"中的`Openlayers`进行预览。

这里选择`PNG`图片格式查看。
 ### 参考文献
[1] `Publicshing a PostGIS Table` https://docs.geoserver.org/latest/en/user/gettingstarted/postgis-quickstart/index.html
### 参考文献
[1] `Publicshing a PostGIS Table` https://docs.geoserver.org/latest/en/user/gettingstarted/postgis-quickstart/index.html